FINANCIAL DASHBOARD
A new proposal for the Cash Flow report in the SaaS market.
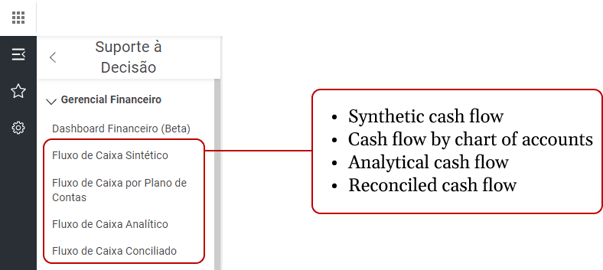
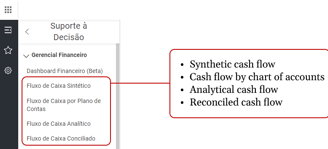
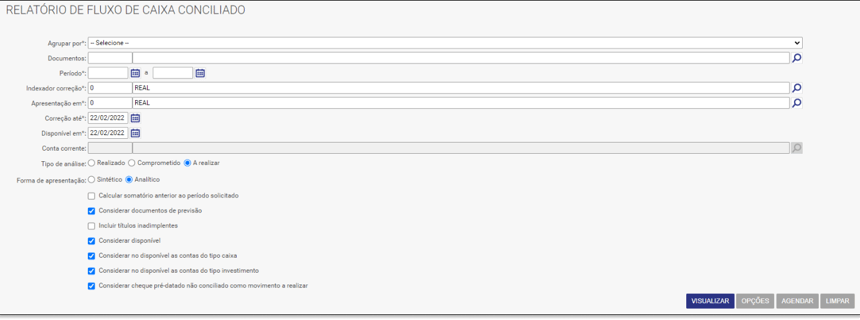
The leading system built for the brazilian civil construction market, has a large amount of financial reports to assist companies in decision making. The issue is that almost all reports are PDFs, making it difficult to analyze the data as the reports get a lot of data and also limiting the use of visuals and charts that could clarify doubts more quickly. Faced with this problem, we decided to study a proposal to build a dashboard, grouping all reports related to Cash Flow. At the moment there are 4 reports that give the same data, but with different views, they are:
Overview
Company: Softplan Planejamento e Sistemas
Product Type: ERP, Web App, B2B, SaaS
My Role: Sr Product Designer
Results Achieved
Decreased menu complexity: The menu has many reports. The project caused at least 4 menu itens do be removed.
Enable presentation at meetings: A complaint was also the lack of options for presenting the reports at meetings.
Analytical view through charts: Possibility of analyzing data not only through traditional reports, but also through a dashboard, both consolidated and detailed.
My role
Using Dual-track as a product development process, I was the only Product Designer on the Financial Squad.
Team
1 Product Designer
1 Product Manager
4 Developers
Strategy and Research
Desk Research
Due to the high complexity of the system, I had to dive in and analyze the reports individually. As I advanced in the study of the reports, I noticed a pattern in the filters used to view the reports. Most of the filters were repeated, which facilitated the development of a first proposal.
User Interviews
I decided to run a qualitative research because although our system was widely used, we knew little about the context of use and also what decisions were taken in the analysis of reports by our users.
My goals
Understand the importance of the Cash Flow reports.
What tools are used alongside PDF reports?
How often are Cash Flow reports viewed?
Insights
During the interviews, I noticed that even though the system was very well sold, it was not used as much as we imagined and users were unable to make decisions through the reports, as the visualization did not facilitate the presentation and a more visual analysis.
Users unanimously validated our hypothesis that PDF reports lacked flexibility and that this made presentations difficult for directors and investors.
Almost all users I interviewed reported that they use tools in parallel with our system, such as PowerBI.
Back to Desk Research
I went back to desk research to see why the system was one of the top sellers but not widely used. I discovered that in the business model used by the company, the system was included in the starter pack, causing many customers to buy it, but they did not have the necessary knowledge to use it.

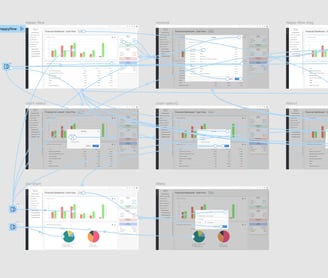
Prototype

** It is important to say that before starting with high-fidelity prototypes, I built the wireframes and validated them internally. I'm not sharing because I don't have the project photos anymore. :(
Strategy and Design Decisions
As I discovered that our tool was limited and not very flexible, but even so the data was considered reliable for decision making, we had a good opportunity to minimize the use of parallel systems, making a dashboard with charts and more interactive.
Design and Solution
During two weeks, I designed and validated through usability tests the new Cash Flow Dashboard. Product Managers, Developers and CS were involved in internal validation for business and technology alignments.
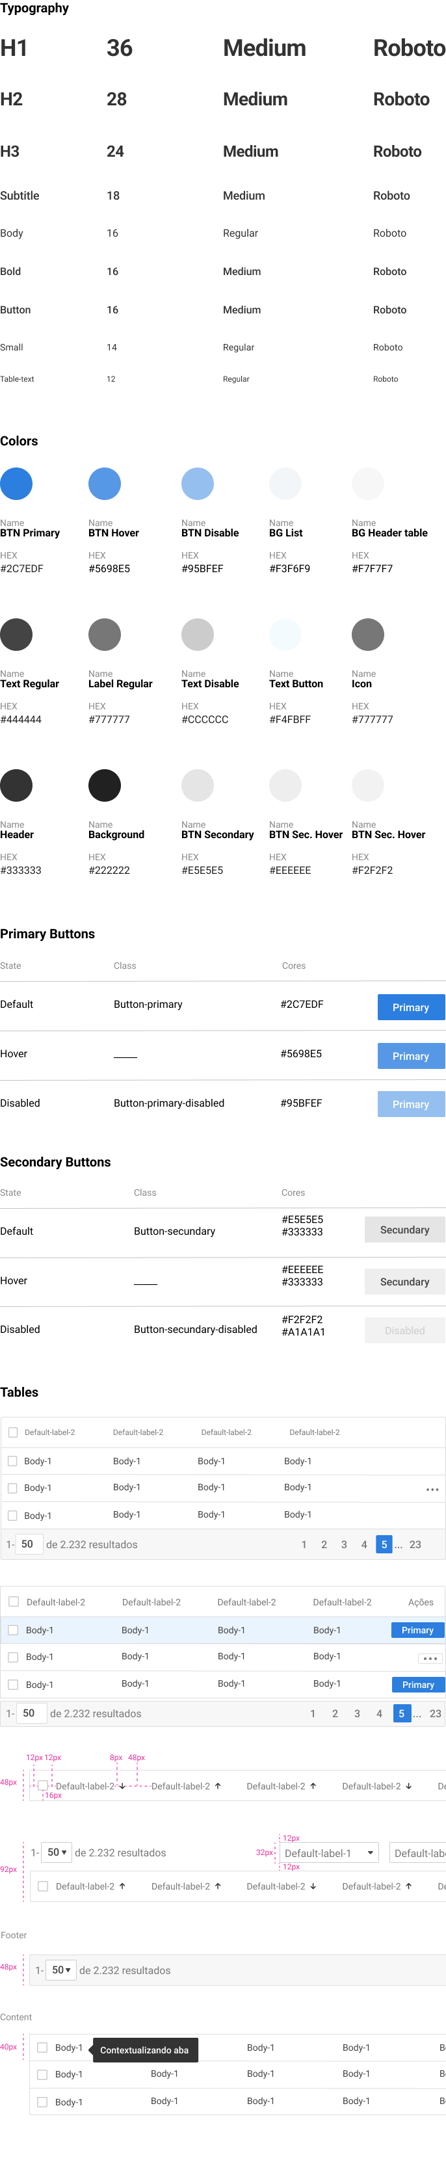
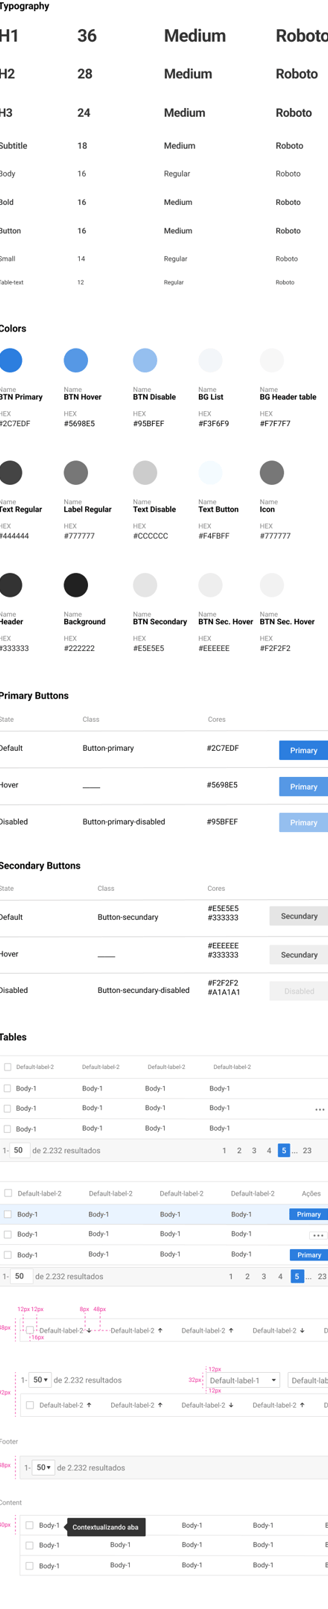
UI and Design System
Below you can see the visual style guide, led and created by me, with the essential help of the Softplan design team.
Components
I've put here just a few basic elements for simple observation.